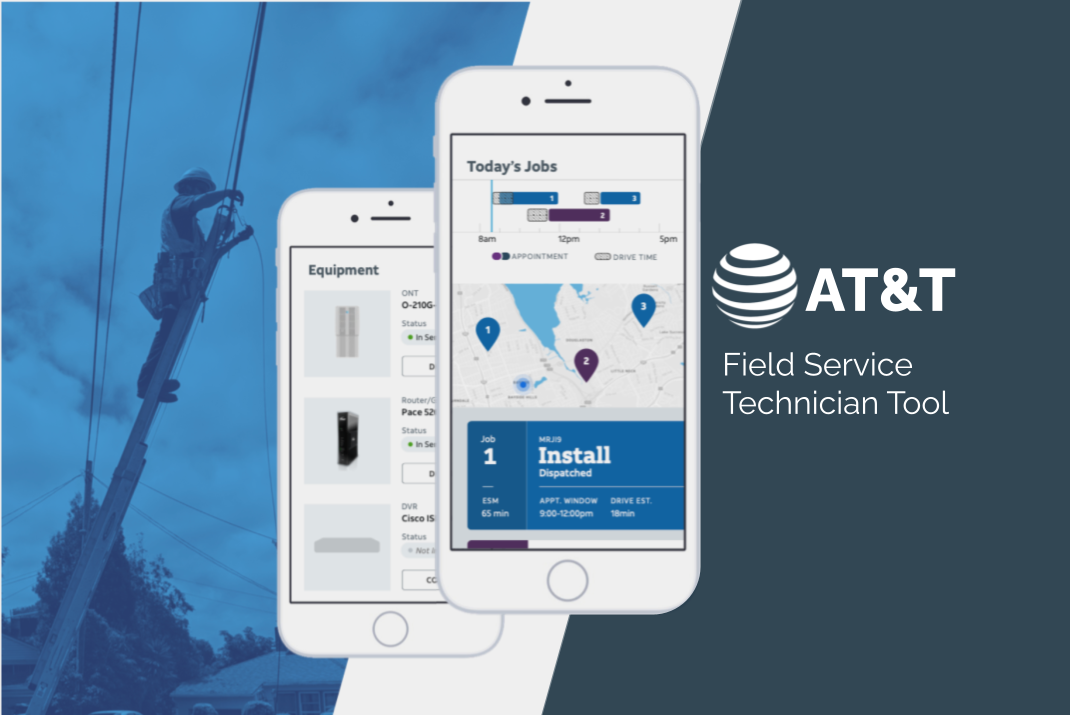
ATLAS: FIELD TECH TOOL
Project Overview
Timeframe: 2 years
Team size: 12+
Role: UX Researcher
Target user: Field technicians
Platform: iPhone, iPad
Tools used: Maze, SurveyMonkey
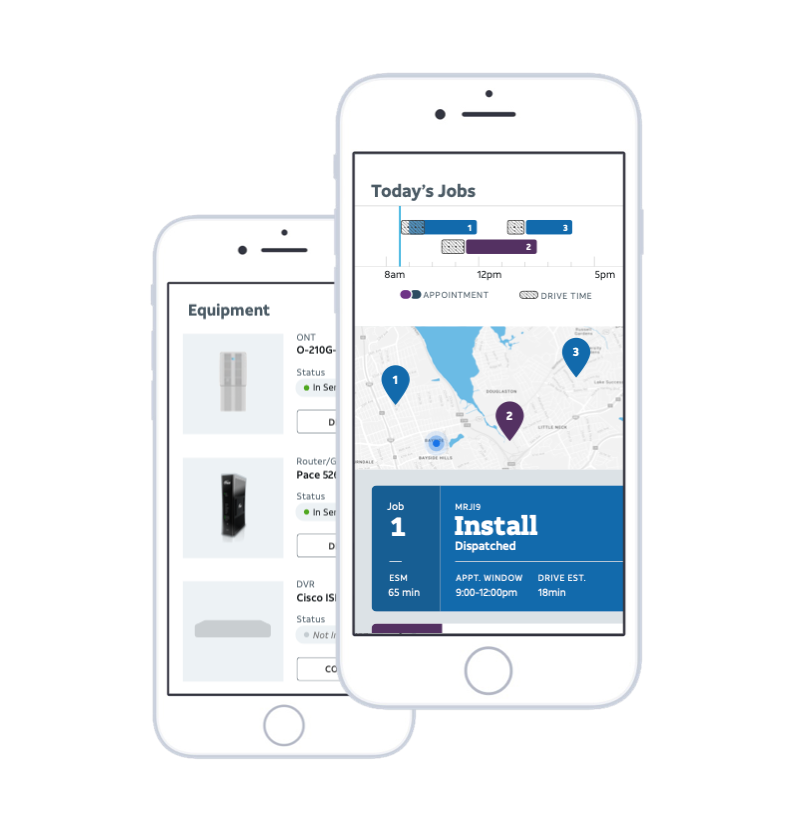
Atlas is a web-app for mobile devices that gives field technicians access to the variety and multitude of systems they need to do their job effectively. It replaces a multitude of out-dated interfaces and platforms by pulling the most important features into a single place and relating information from them together in a meaningful way.
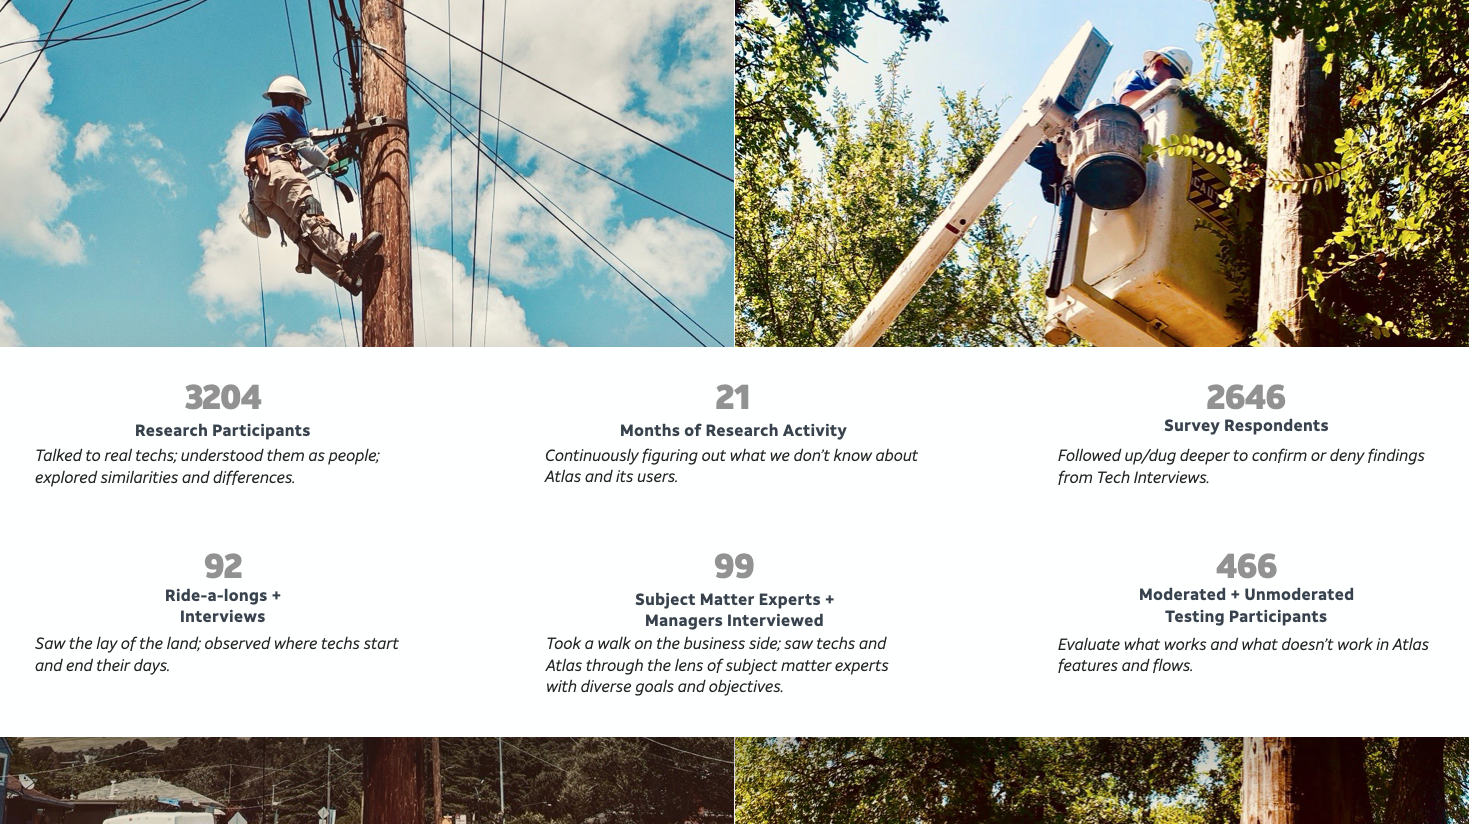
I facilitated benchmarking analysis using the System Usability Scale, launched unmoderated remote studies to test designs, sent out surveys to keep track of tech’s needs and desires, held interviews with subject matter experts, techs, and managers in order to understand processes, and took part in and coordinated in-field ethnographic studies.
BACKGROUND
THE USER
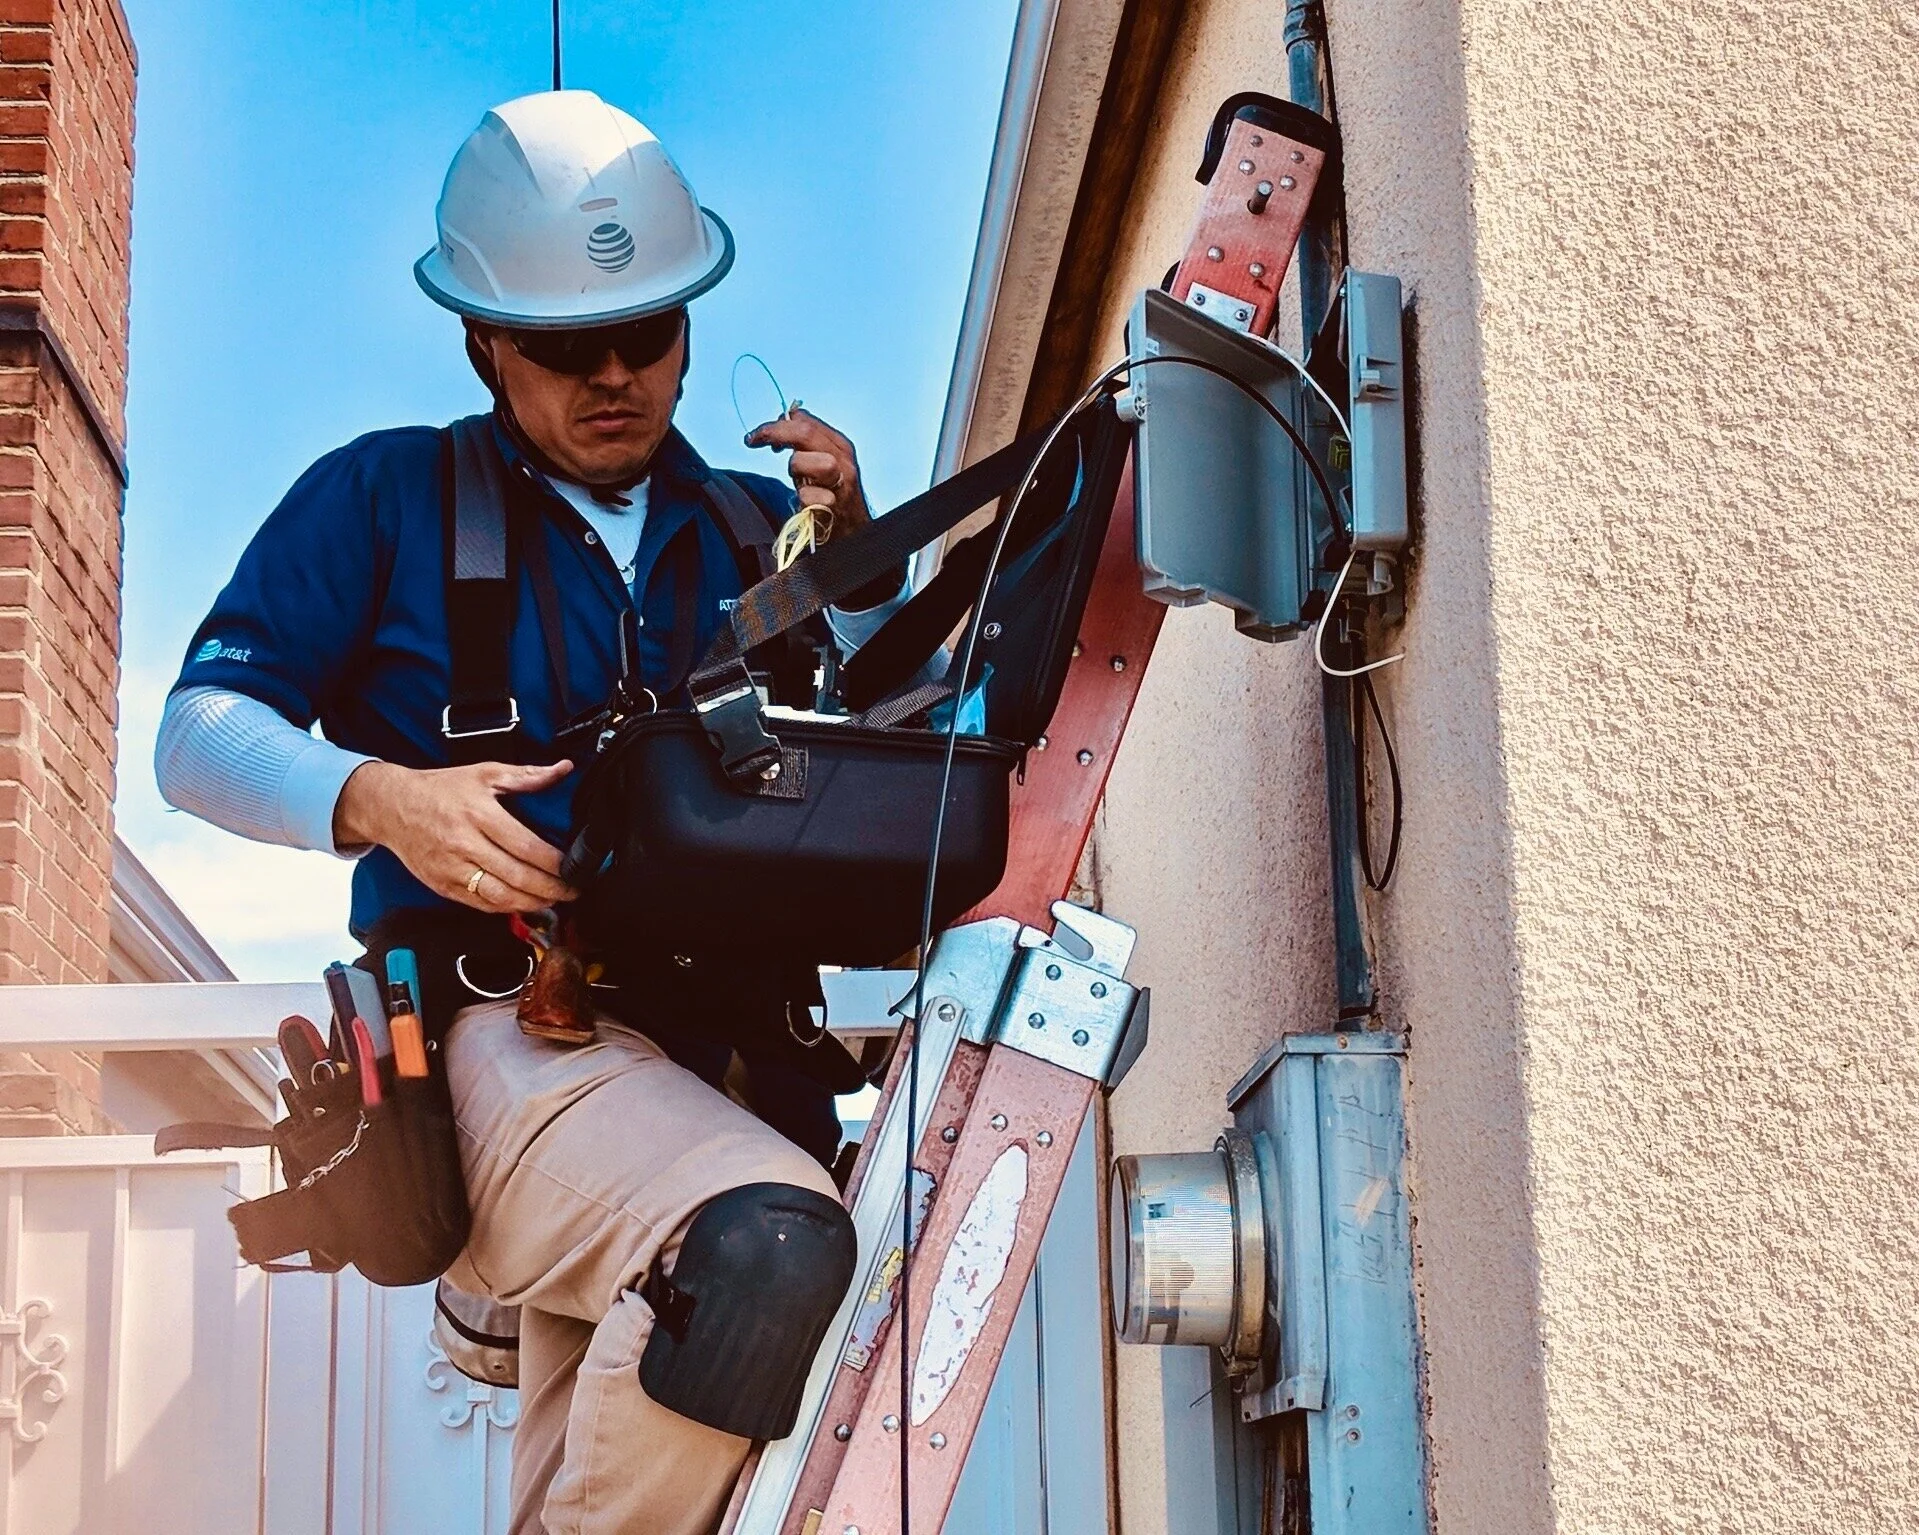
Field techs install and repair internet based services for consumers and small businesses but the environments they work in and services they perform vary widely.
Although many of the subject matter experts had previously been field techs, the working landscape has changed considerably. It was imperative that throughout the project I advocate for a change in mindset of who the field techs are.
A key tenet of this project was involving field techs every step of the way. There was considerably bias against techs and this project was an opportunity to change that by pushing for something better than ‘business as usual’.
Field techs have varying access to a variety of platforms, however these platforms do not interact with each other and the information shown may appear contradictory.
This project was a collaboration between two departments; the team we worked closely with consisted of subject matter experts, many of whom had been field techs themselves (however, that was decades ago).
While the overall project is straightforward, the tools and processes within them are not. The infrastructure is complicated, both on the backend and in real life.
In order for Atlas to be successful, there needed to be an overhaul of systems and of the business’s view of how techs work.

METHODOLOGY
ETHNOGRAPHY
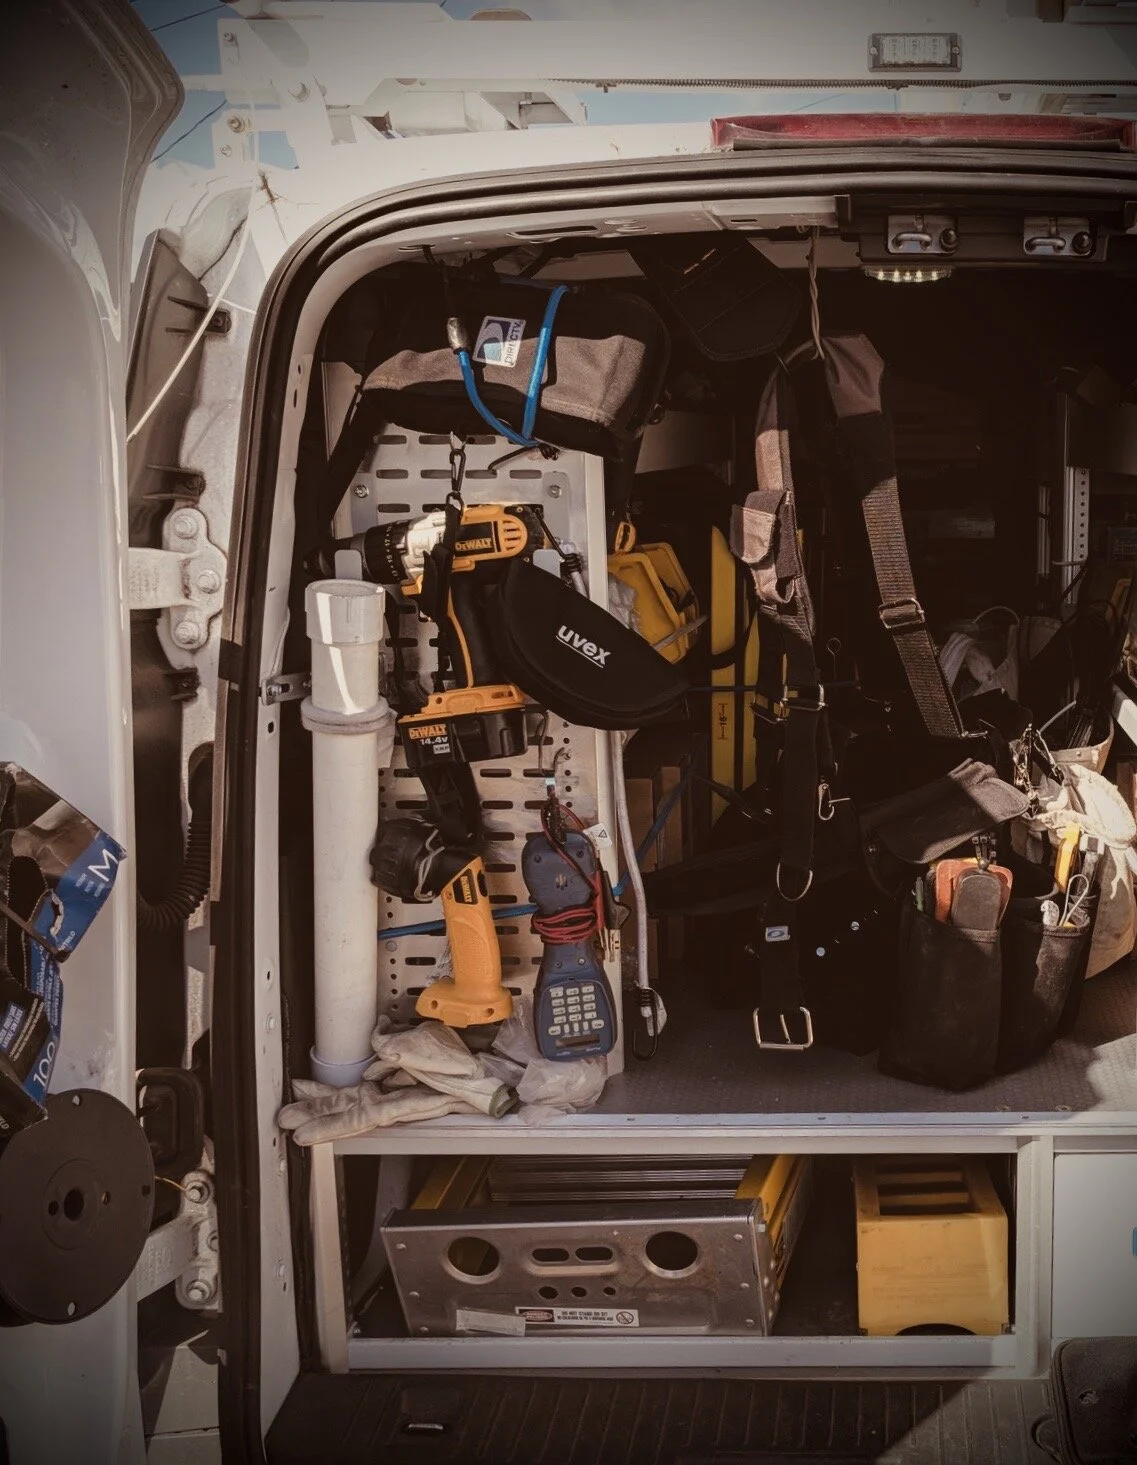
Field tech processes, information, and job tasks are complicated. The most straightforward way to understand how a tech works is to be in the field with a tech. While ethnographic research was vital in the lead-up to deployment of Atlas, it was no less important once released. Ethnography provided a way for us to track Atlas and identify critical bugs and performance issues that we could not address with QA. Atlas requires ‘jobs’ to run; a job entails much more than what Atlas can provide, a tech must do physical work and and be able to handle physically working with wires, this meant that creating a dummy ‘job’ was extremely complicated and unable to encompass the true essence of a job. This made ethnography invaluable as we were reliant on it to view real-life cases as they came up.
SURVEYS
In order to track the most pressing issues that techs want and need to see addressed, I deployed regular surveys. This allowed me to keep project planning informed and provide ammo to push-back if the prioritization of work did not align with in the field, real world needs. Tech’s time is limited, so surveys had to be as straightforward and easy to navigate through as possible, requiring ideally up to 5 minutes of their time and by no means more than 10 minutes.
REMOTE STUDIES
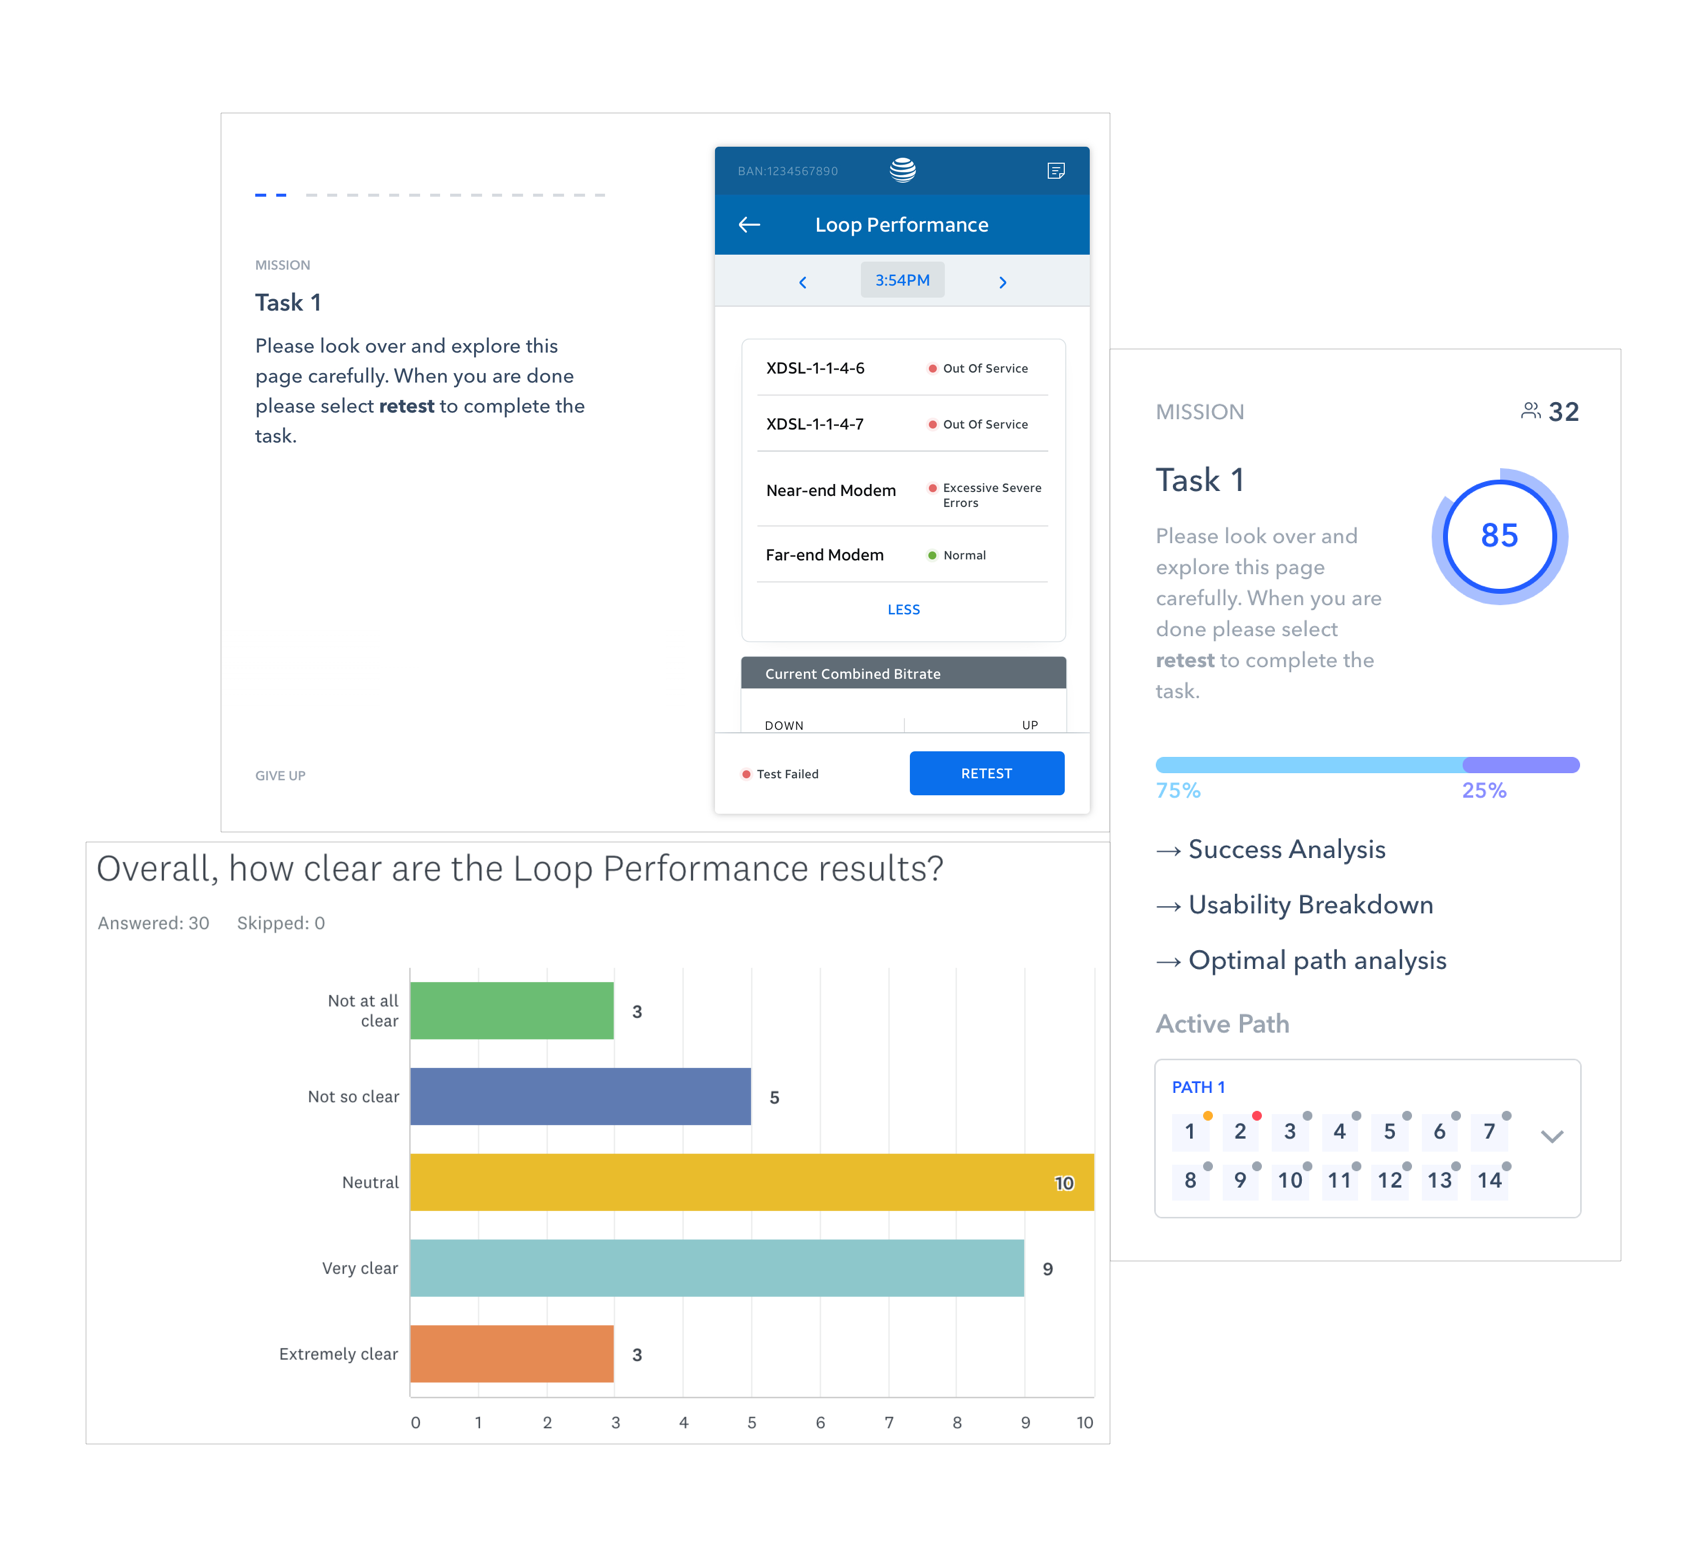
Techs may not download anything to their device that is not approved by the business, this meant that I had to come up with crafty ways of deploying usability tests to them without the use of commonly used tools (like UserTesting or UserZoom, etc.). Furthermore, just as with surveys, time is limited so they must be able to be completed in less than 10 minutes.
SurveyMonkey became my go-to tool. I would edit prototypes for the designs I was testing and asks techs to maneuver between the survey and links to Invision prototypes. While this was not ideal, techs valued being involved in the design of Atlas and having their voice heard. It also helped that there are around 14,000 techs in total, so I was able to send out many studies but not overload a single tech with my ask.
BENCHMARKING
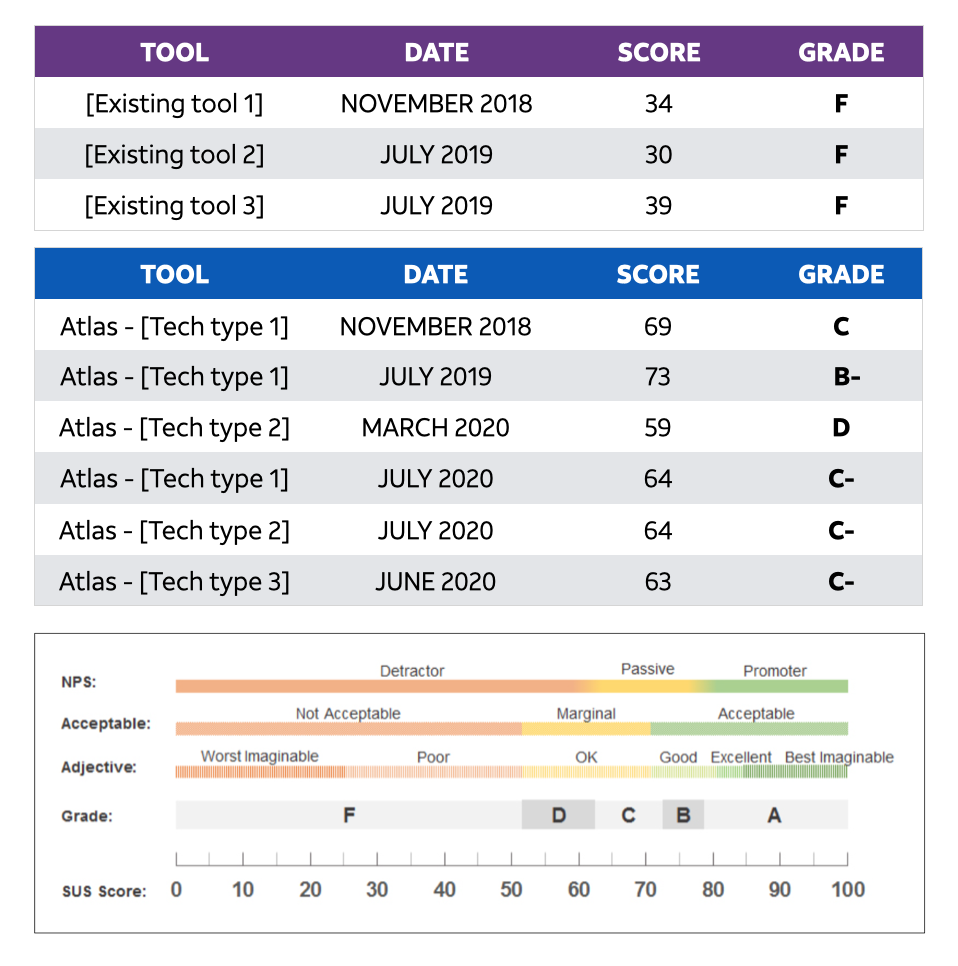
I used the System Usability Scale to benchmark the progress of Atlas. I would deploy studies no less than 3 weeks after major improvements, fixes, or features had been released. This ensured that techs had time to familiarize themselves with the tool and the changes. With every SUS survey sent, an additional set of qualitative questions were asked to help give clarity on the score.
What did you like most?
What did you like least?
What would you change?
Any additional comments
These questions were asked in open text fields, allowing for techs to use their own language to describe what they wanted.
My findings covered what was working well, what wasn’t working well (i.e. features requested), and bugs needing to be fixed. Parsing through feedback from techs was not necessarily straightforward, considering techs may interpret the system as broken when in reality a feature had not been built yet or vice versa, it would become clear from their feedback that features were in fact broken or had been implemented in ways they hadn’t been designed for.
The other aspect of the themes included business rules worth investigating or pushing back on. Techs are held to a variety of metrics to determine their performance. Since jobs may entail a multitude of unknowns and reality is never as simple as what they are taught on paper, the feedback showed where metrics may actually be competing with each other. In other words, techs would be put in lose-lose situations and not incentivized to follow rules put in place because doing so would make them perform poorly on the metrics used to determine if they were doing their job well.
FINAL DELIVERABLE: AN ALL INCLUSIVE GUIDE OF THE USER
As part of the ramp up to handing-off this project to our partners, I lead a research effort to compile all primary and secondary research to inform an inclusive guide detailing who the techs are. The guide is intended to help onboard new project members so they may quickly get acquainted with the user they are building for.
I worked closely with designers on the partner team to help teach them research best practices and boost their confidence in being able to carry the torch with the overall effort.
The guide created is an exercise in empathy; it dives deep into tech behaviors, motivations, and attitudes of the techs.